Models & Data
Welcome to the CCMP Models page, your gateway to open-source models, data sources, and links to various modeling activities and resources. If you feel you have anything at all to add to this page, please contact CCMP.
Data
 Chesapeake Bay Environmental Observatory
The Chesapeake Bay Environmental Observatory (CBEO) collection of data and tools is probably one of the most exhaustive for the Bay ecosystem and watershed. Click here to go to the CBEO home page.
ORET Database
The Oyster Restoration Evaluation Team (D. Breitburg, M. Christman, V. Kennedy, M. Luckenbach, R. Mann, K. Paynter) received data from 12 sources in Maryland and Virginia and constructed a database using Microsoft Access. The data were assembled in tables that incorporated site information; monthly data in relation to a particular Bay geographic segment (there are 92 segments in the Bay; see USEPA, 2008); information on water quality in each segment; a listing of restoration activities; and a listing of monitoring activities (see ORET, 2009 for a view of the database architecture and how the user interface operates). The resulting 73,549 entries cover the diverse set of activities that comprised restoration and monitoring of oyster bars in the Bay. Entries are both geographically and temporally referenced, and the database is accessible for statistical (e.g., SAS, R) and GIS (e.g., ArcGIS) analyses.
Restoration: Five major types of restoration activities were defined within the database. These fell into two categories: (1) efforts to enhance the adult stock of oysters on a bar to provide for sustained reproduction or commercial harvests and (2) efforts to improve the physical habitat of a bar to encourage subsequent larval settlement or to remove diseased oysters.
Monitoring: Various types of monitoring are relevant for evaluating restoration success. Monitoring of bars not receiving restoration activities (non-restored bars) provides important reference points (or controls) for comparison with sites receiving restoration efforts (restored bars). Data collected at restored and non-restored bars included date of collection, measurements of oyster abundances, individual size, and disease prevalence and intensity.
To see the paramters available, download the Parameters and Definitions table below. For data access, please contact Kevin Sellner, CRC, at sellnerk@si.edu.
- Parameters and Definitions
- Activity Table
- Oyster Bar Table
- Monitoring Date Table
- Monthly Segment Data Table
- Segment Table
Watershed
 Chesapeake Bay Program's Watershed Model
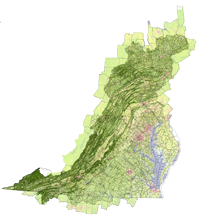
The Chesapeake Bay Community Watershed Model is an implementation of the HSPF model for the full Chesapeake watershed. Using this model, a group can determine the nutrient and sediment loads delivered to the Bay under various management strategies. By installing this model, supplying data on management practices, land use, and/or other relevant factors, and following the steps to run the model, users can determine the loads that result.
- Completed in 2000, this version is currently in use by the CBP partners. The calibrated model, pre- and post-processors, input files, and scripts for running are available.
- You can now download version 5.3 (updated 6/2/2010)
PIHM (Penn State Integrated Hydrologic Model)
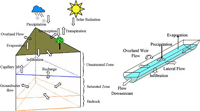 The Penn State Integrated Hydrologic Model (PIHM) is a multiprocess, multi-scale hydrologic model where the major hydrological processes are fully coupled using the semi-discrete finite volume method. The model itself is "tightly-coupled" with PIHMgis, an open-source Geographical Information System designed for PIHM. The PIHMgis provides the interface to PIHM, access to the digital data sets (terrain, forcing and parameters) and tools necessary to drive the model, as well as a collection of GIS-based pre- and post-processing tools. Collectively the system is referred to as the Penn State Integrated Hydrologic Modeling System. The modeling system has been written in C/C++, while the GIS interface is supported by Qt. The Penn State Hydrologic Modeling System is open source software, freely available for download at this site along with installation and user guides.
Fore more information, visit the following links:
 SPARROW (Spatially Referenced Regressions On Watershed Attributes)
SPARROW relates in-stream water-quality measurements to spatially referenced characteristics of watersheds, including contaminant sources and factors influencing terrestrial and stream transport.
 CBFS (Chesapeake Bay Forecasting System)
CBFS is a flexible, end-to-end expert prediction tool for decision-makers that will provide customizable, user-specified forecasts showing multiple aspects of the region's climate, air and water quality, local chemistry and ecosystems months into the future. Users will be able to configure their own "what if" scenarios and then see the results of specific land-use choices, climate trends, development, demographics or environmental conditions on particular sections of the bay.
Hydrodynamic Circulation
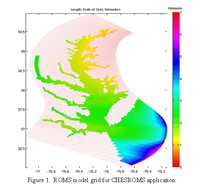 ChesROMS (Chesapeake Bay ROMS Community Model)
The MerhabChes program is developing a ROMS model of the Bay to be run in operational mode (ie, once a day). It will be used by the MerhabChes program to help in the prediction of Harmful Algal Blooms. The full implementation will be developed here, and all intermediate modeling results and methods will be available for public use and scrutiny. We hope to catalyze a new method of community modeling with involvement beyond the core researchers of the MerhabChes project.
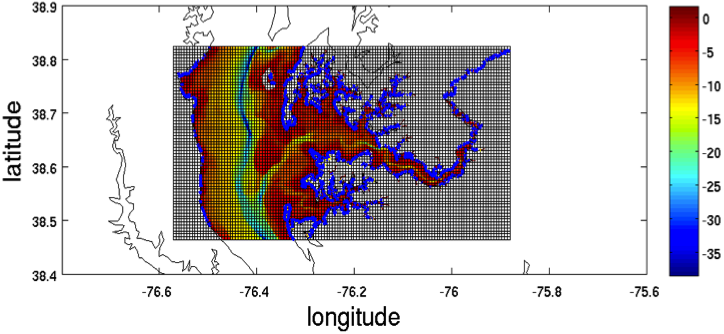 CHOPROMS – Choptank Regional Ocean Modeling System
An open source, high resolution hydrodynamic model of the Choptank River has been developed by Elizabeth North, Wen Long Zachary Schlag and Steven Suttles. The model is based on the ROMS model.
- CHOPROMS is open source and avaialble at http://sourceforge.net/projects/choproms/
- Grid Resolution: 120 ~ 150 m
- Grid Dimension: 261x501
- Coupled with ChesROMS at OBC
- Supported by Army Corps of Engineers for oyster larvae transport in Harris Creek
- Model computationally intensive, takes 5 days wallclock for a 6-month prediction on 48 processors
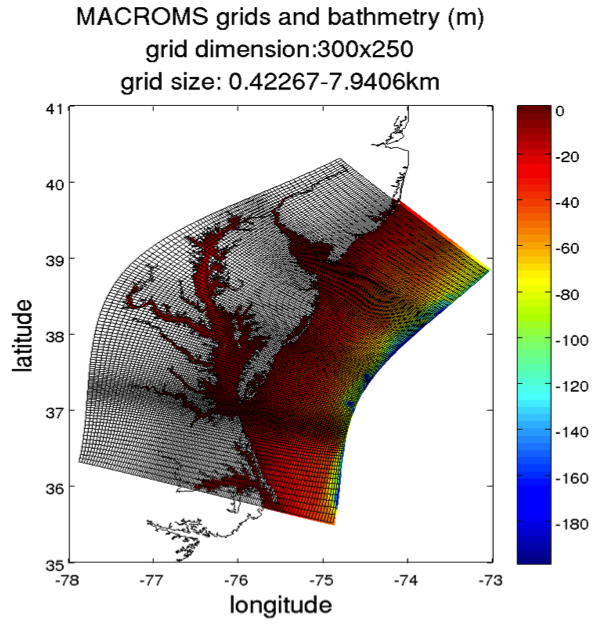 MACROMS- Mid-Atlantic Coast, Chesapeake and Delaware Regional Ocean Modeling System
An open source hydrodynamic model of the Mid Atlantic Coast and Chesapeake and Delaware Bays has been developed by Elizabeth North, Wen Long Zachary Schlag and Steven Suttles. The model is based on the ROMS model.
- MACROMS is open source and avaialble at http://sourceforge.net/projects/macroms/
- Grid Resolution: 0.4~7.9 km
- Grid Dimension: 301x251
- Coupled with MABGOM (NCSU, PI: Ruoying He) at OBC
- Supported by MD Sea Grant for the study of blue crab larvae transport among the Delaware/Chesapeake system
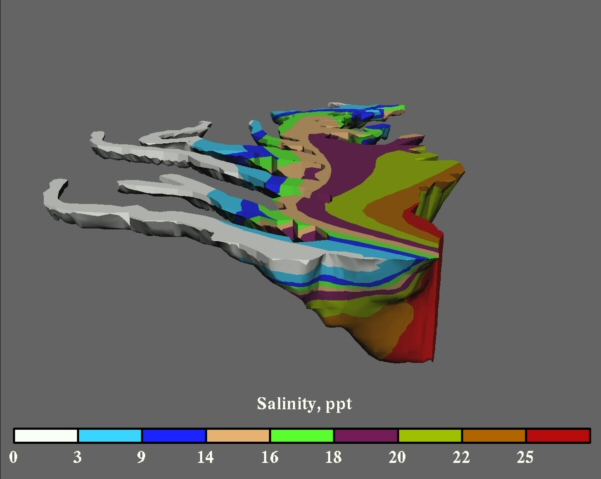
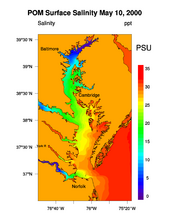 POM
POM
This is a contribution from Xinyu Guo, ODU/CCPO. This implementation of POM has been calibrated for the Chesapeake Bay and uses the same NetCDF ouput file format as the above Quoddy implementation.
Chesapeake Interactive Modeling Project (CHIMP)
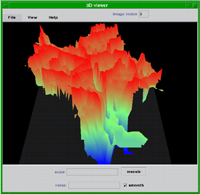
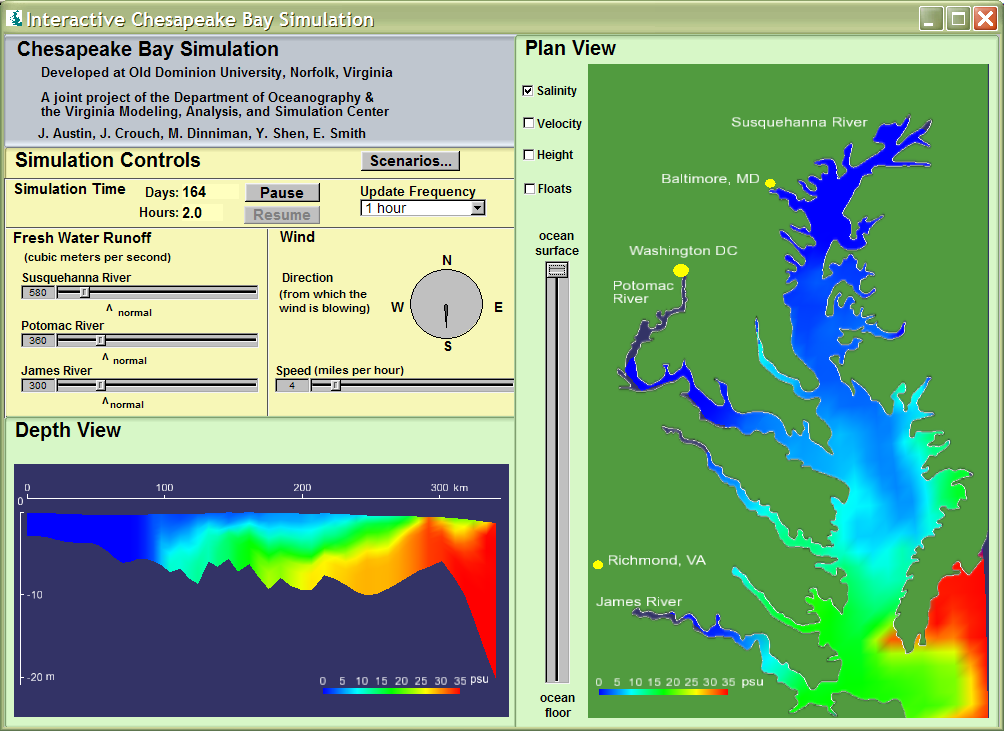 CCMP member researchers have put together a very exciting interactive teaching tool. Jay Austin, Large Lakes Observatory, U. Minnesota, and his former Old Dominion colleagues, Jessica Crouch, Mike Dinniman, Yuzhong Shen, John Klinck, Elizabeth Smith, and Lee Belfore, have put together a slimmed down ROMS simulation of the Chesapeake Bay with an easy to use GUI. The tool allows students (myself included) to manipulate the physical forcing of the bay and quickly see results. The ability of this tool to develop intuition about the Bay is remarkable. Check it out here.
![]()
Biochemistry
CE-QUAL-ICM 3-D Eutrophication Model
 CE-QUAL-ICM Version 1.0 is a three-dimensional eutrophication model for the Chesapeake Bay and major tributaries developed by researchers at the U.S. Army Corps of Engineers Engineering Research and Development Center in Vicksburg, MS. This model study was sponsored by the Chesapeake Bay Program Office (CBPO), U.S. Environmental Protection Agency, and the U.S. Army Engineer District, Baltimore (CENAB).
- Introduction
- Model Limitations
- Project Summary & Conclusions
- Model Enhancements
- CE-QUAL-ICM on Sourceforge
Continue to the CE-QUAL-ICM website
 LTRANS: Larval Transport Lagrangian Model
The Larval TRANSport Lagrangian model (LTRANS) is an off-line particle-tracking model that runs with the stored predictions of a 3D hydrodynamic model, specifically the Regional Ocean Modeling System (ROMS). LTRANS has also been implemented for a finite element hydrodynamic model (QUODDY) but the code is not ready for release. Although LTRANS was built to simulate oyster larvae, it can easily be adapted to simulate passive particles and other plantonic organisms.
- Read more on the LTRANS homepage
BioGeoChemical Processes
Jiangtao Xu and Raleigh Hood's model of the biogeochemical processes in the Chesapeake Bay is presented with input files to run full year simulations for 1995 and 1996. The model was developed for Jiangtao Xu's dissertation.
Oyster larvae development simulation
An oyster larvae development model for the C. virginica larvae as a function of temperature, salinity, food concentration and turbidity concentration.
Chespeake Bay Oyster Larvae Tracking Tool and IBM Particle Tracker
The CBOLT tool allows a particle tracking ability to be accessed easily from a web page. The underlying models access the results of theC3PO model or the POM model to provide velocity fields. Particle tracking code was written in C++ to allow expansion to object oriented programming of IBM models. The Oyster larvae development simulation model may be embedded into the particle tracker to trace life histories of oyster larvae while they move about the bay.
The Oyster tracking tool, (oceanmodelfiles on SourceForge), is nearing completion and can be used with C3PO or the POM model output files. Future enhancements will be to connect the above oyster larvae development model within the particle motion of the program. The result will be an Individual Based Modeling system which will follow the life history of oyster larvae through both time and space.
Supplemental Modeling Tools
 Riparian Analysis Toolbox
The Riparian Analysis Toolbox contains three categories of tools for analysis of digital elevation, hydrographic, and land cover data within ArcGIS 9x: (1) Riparian Delineation Tools, (2) Buffer Width Calculators, and (3) Strategic Prioritization Tools. The Riparian Delineation Tools identify a topographically-defined riparian zone by elevation relative to stream channels. These delineations are intended to help identify biogeochemically active areas important for nutrient filtering. The Buffer Width Calculators estimate the width of buffer between each pixel of source area and streams using single or multi-direction routing algorithms ( Baker et al. 2006, Tarboton and Baker 2008). The Strategic Prioritization Tools use these and similar calculations to rank existing buffers or candidate restoration sites by the amount of pollutant loading from upslope sources.
Mapping Sea Nettles in the Chesapeake Bay
Sea nettles, Chrysaora quinquecirrha, seasonally infest the Chesapeake Bay and affect many activities on the Bay. Knowing where and when to expect this biotic nuisance may help to alleviate this problem.
Maps of probable sea nettle presence are created by identifying locations where the current environmental conditions are favorable to sea nettles. This is accomplished using data derived from hydrodynamic computer models and NOAA satellites.
- Read more on the Mapping Sea Nettles page @ NOAA
BASINS
 Better Assessment Science Integrating Point & Non-Point Sources
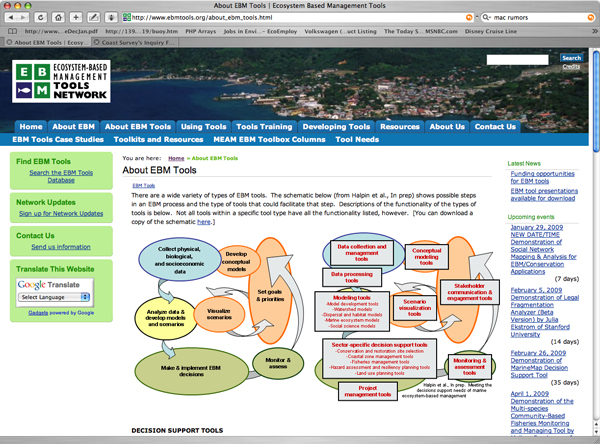 Ecosystem-Based Management Tools Website
The EBM Tools Network has released a website with a database of ecosystem-based modeling tools. This site is brought to you by the EBM Tools Network, an alliance of EBM tool developers, practitioners, and training providers to develop EBM tools and support their use in EBM implementation in coastal and marine environments. Network members include Duke University, Ecotrust, The Nature Conservancy, NatureServe, NCEAS, NOAA, the Orton Family Foundation, the David and Lucile Packard Foundation, Princeton University, and the Sea Around Us Project.
For more information about the website or the EBM Tools Network, contact:
Dr. Sarah Carr
EBM Tools Network Coordinator, NatureServe
E-mail: sarah_carr@natureserve.org
Phone: 703.908.1892
Spatial Modeling Environment
 The Spatial Modeling Environment is a software system which connects watershed modeling components to build comprehensive environmental modeling systems. Alexy Voinov, now at Univ. Vermont, worked with the SME and applications to the Patuxent Watershed.
Other Modeling Resources
Presentation: Models of the Chesapeake Basin
Models presentation
Kevin Sellner, CRC Director, was asked to present a comprehensive listing of models used across the Chesapeake basin for a JHU class lead by Grace Brush. Many in the modeling community provided a few slides on each of their models and following the class, several of the modelers requested that the summary be posted as an overview of some of the modeling capacity throughout the region. Please consider this as a personal collection from Kevin and inclusion/exclusion in no way implies support or rejection of models in the region. Also note that most models only have a few slides presented, with the majority of information likely presented verbally in the class. The contact information for each model/modeler is included for each approach, and these individuals should be contacted for more detailed information. Kevin can be reached at sellnerk@si.edu.
The presentation is available below in Flash and pdf formats. For the flash version, please click each slice to advance the presentation.
View: Flash version | PDF version
Chesapeake Bay Bathymetry Data Set
- Bathymetry Data Set - A MatLab version
- Bathymetry Shapefile
- Contributed by Weiqi Lin, Larry Sanford, Steven Suttles, UMCES, HPL
List of Models
- WGPBI Inventory of Operational and Preoperational Models
- EPA Water Models List
- Ocean/Atmosphere Models
- ODU Dept. Civil and Environmental Engr. List